Your phone already knows more about your mental health than your therapist does
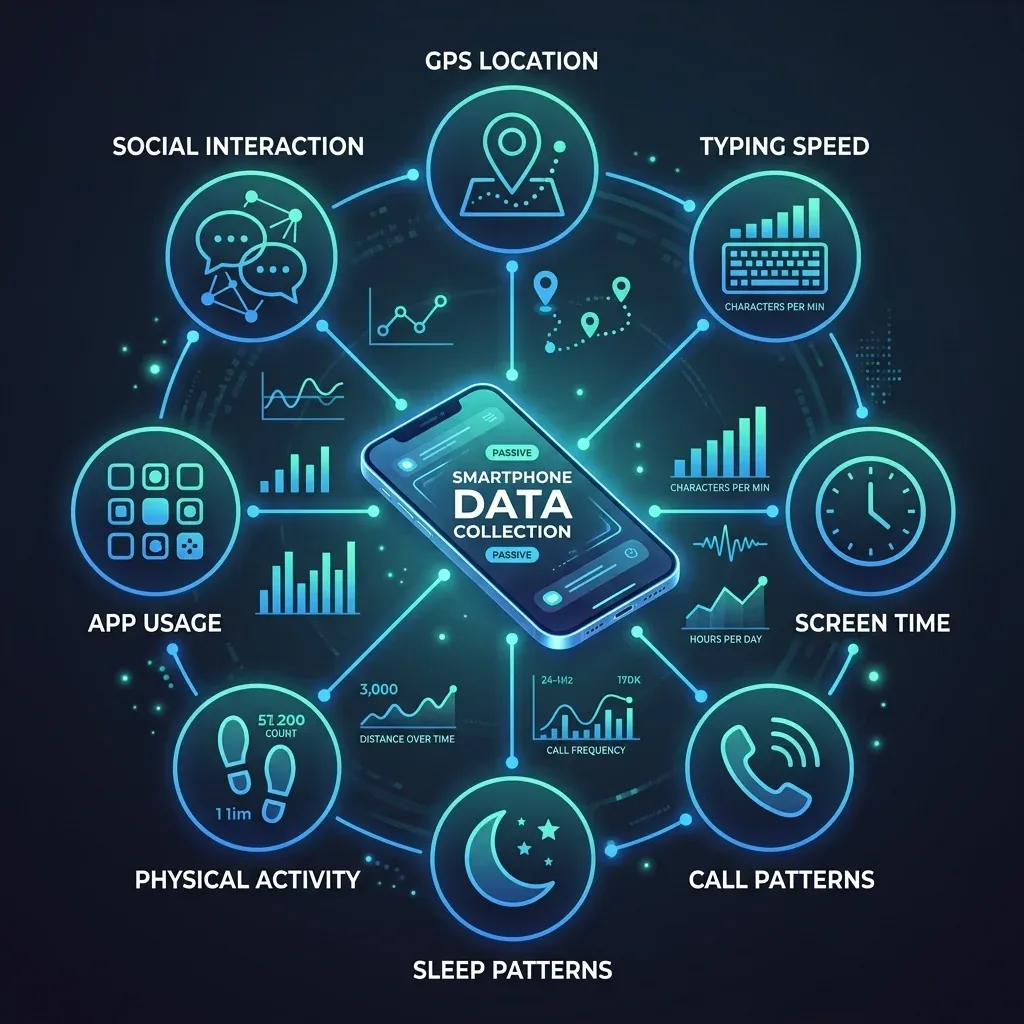
Every time you pick up your phone, hesitate before typing a word, scroll past a notification without opening it, or stay home instead of going out, you are generating data. Not the kind you think about, not the Instagram post or the text message. The data that matters for digital phenotyping is the behavioral exhaust: how fast your thumbs move across the keyboard, how far you travel from home on a Tuesday, how many times you check your screen between midnight and 4 AM.
The term "digital phenotyping" was coined by researchers at Harvard University around 2015, led by biostatistician Jukka-Pekka Onnela and psychiatrist Scott Rauch. Their idea was straightforward: smartphones contain accelerometers, GPS chips, microphones, and touchscreens that generate continuous streams of behavioral data. If you could capture and analyze that data, you could build a real-time portrait of someone's psychological state without ever asking them a single question.
Think of it like a weather station for your brain. A weather station doesn't ask the sky how it feels — it measures temperature, barometric pressure, humidity, wind speed, and uses those readings to forecast storms. Digital phenotyping works the same way, but instead of atmospheric sensors, it uses the sensors already embedded in the device you carry everywhere.
The range of what gets measured is broader than most people realize. A 2023 systematic review in the Journal of Medical Internet Research cataloged the features researchers extract from smartphones and wearables: mobility and location patterns, phone usage frequency, call logs, heart rate, sleep metrics, head movements, facial and vocal characteristics, social interaction patterns, steps taken, screen on/off cycles, text message logs, skin temperature, electrodermal activity, and light exposure. One study at Imperial College London engineered 92 distinct passive features from phone sensors alone, tracking everything from location entropy to the number of entertainment apps opened at night.
Digital phenotyping data falls into two categories. "Content-free" measurement captures only the timing and speed of your interactions — how fast you type, how long between taps — without recording what you actually write. "Content-rich" measurement includes geolocation, search history, and social media activity.
This distinction matters because as Stanford researchers have noted, even content-free data can reveal sensitive mental health information. Your typing speed at 2 AM tells a story. The gap between when you pick up your phone and when you put it down tells another. None of these data points look like health information on their own, but when fed through machine learning algorithms, they become precisely that.
For anyone carrying a smartphone, the practical reality is this: the device in your pocket is already collecting most of the raw data that digital phenotyping uses. The difference between your current phone and a digital phenotyping tool is the software layer that analyzes it — and increasingly, that layer is being built.
What your GPS history reveals about depression
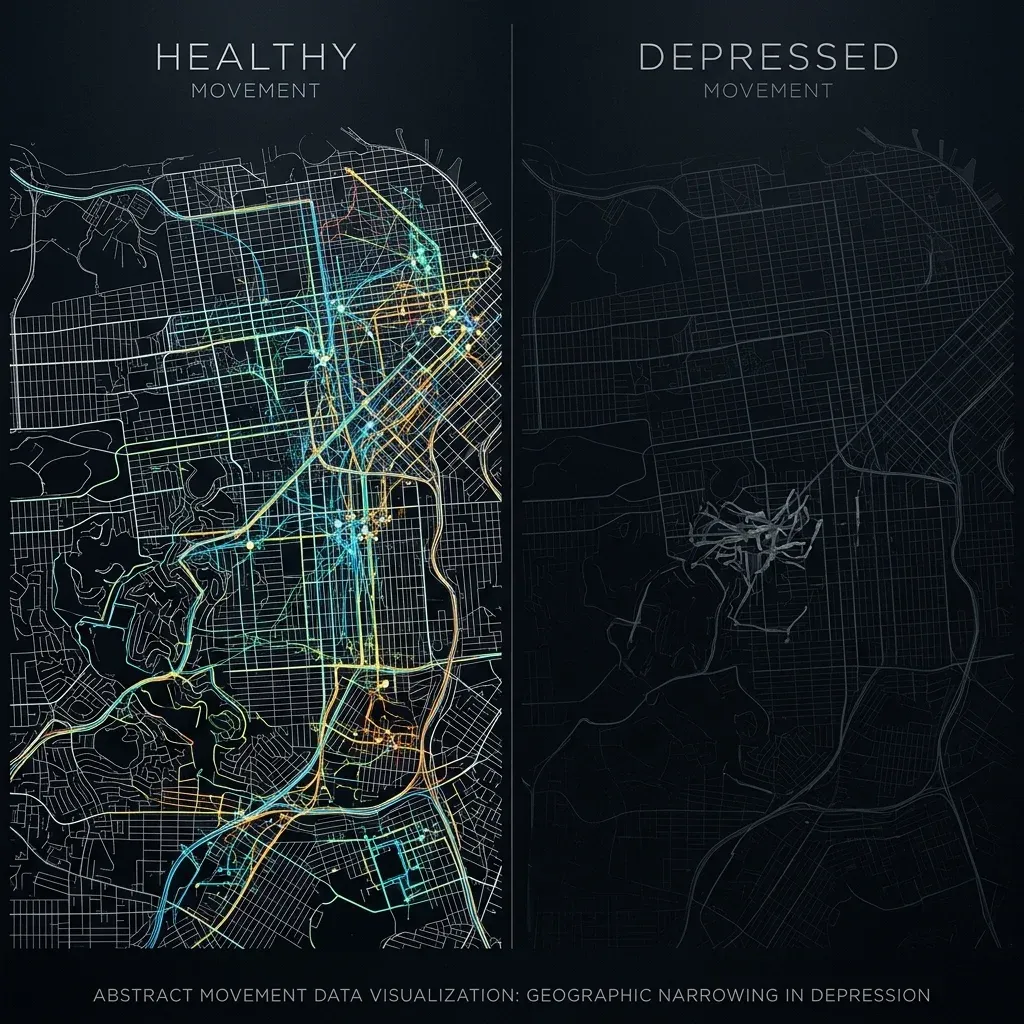
Depression shrinks your world. That observation is ancient — clinicians have documented social withdrawal and reduced activity for centuries. What digital phenotyping adds is the ability to measure that shrinking in real time, down to the meter.
A 2025 study tracking 183 patients diagnosed with major depressive disorder over 12 weeks found that reduced geographic mobility correlated with depression severity at r = -0.42. Decreased social app usage showed a similar pattern at r = -0.38, and disturbed sleep patterns registered at r = 0.40. These are not subtle signals. A correlation of 0.42 between GPS mobility and depression severity is stronger than many associations used in clinical medicine.
The landmark finding in this space came from Saeb and colleagues, who studied 40 participants over two weeks and found that variance in locations visited correlated with depression at r = 0.58, and regularity in 24-hour movement patterns at r = 0.63. The pattern is consistent: depressed people visit fewer places, stick to more rigid routines, and show less variability in their daily movements.
But depression doesn't just show up in your GPS. It shows up in how your fingers move.
Researchers at the University of Illinois built a custom keyboard called BiAffect that unobtrusively captures how people type — not what they type, but the speed and error patterns of their keystrokes. In a study of 128 adults tracked over 2,948 observations, they found that a single metric — backspace rate — could distinguish between depression and mania. People with medium backspace rates showed significantly higher depression ratings (b=2.32, P=.008), while those with high backspace rates showed elevated mood, increased motor activity, and greater irritability — classic markers of mania.
This maps onto what clinicians observe in their offices: depression slows cognition and makes people more deliberate (moderate self-correction), while mania accelerates thinking and makes people more impulsive (excessive self-correction). The keyboard just measures it continuously, passively, and without the person having to remember to report it.
The sleep signal is equally telling. The StudentLife study at Dartmouth, which tracked 48 students over 10 weeks, found that sleep duration correlated with mental health symptoms at r = -0.360, and that activity levels showed an even stronger relationship at r = -0.388. When your phone detects that you're staying in bed later, moving less during the day, and using your screen more at night, it's picking up on the same behavioral changes a psychiatrist would notice — just weeks earlier.
Multiple research groups have confirmed that digital phenotyping can detect signs of relapse days before symptoms become clinically apparent. For conditions like schizophrenia, where a systematic review found passive data predicted relapse "very effectively" using apps like CrossCheck and Beiwe, those extra days of warning could prevent hospitalizations.
Traditional psychiatric assessment relies on office visits that happen every few weeks at best. Between appointments, clinicians have no data. Digital phenotyping fills that gap with continuous behavioral measurement that doesn't depend on patients accurately remembering and reporting their symptoms.
The generation that never puts the phone down is the easiest to monitor
Three statistics frame why researchers keep returning to teenagers. The World Health Organization estimates that 1 in 7 adolescents aged 10-19 lives with a diagnosable mental disorder. Over 75% of all lifetime mental health conditions first appear before age 25. And only 18-34% of young people with significant symptoms ever seek professional help.
Two-thirds of struggling teenagers never walk through a therapist's door. They don't fill out questionnaires. They don't call crisis lines. But they do use their phones — on average, seven or more hours per day. The data gap that makes adolescent mental health so difficult to address is the same gap that digital phenotyping is designed to fill.
The most comprehensive adolescent digital phenotyping study to date was published in the Journal of Medical Internet Research in 2026. A team led by Aldo Faisal at Imperial College London recruited 103 adolescents (mean age 16.1) from three UK secondary schools and had them use a smartphone app called Mindcraft for 14 days. The app collected daily self-reports — mood, sleep quality, loneliness — alongside continuous passive sensor data: location coordinates, step counts, app usage categories, ambient light levels, and background noise.
The numbers are worth examining closely. Using a deep learning model with contrastive pretraining, the researchers achieved balanced accuracies of 0.77 for predicting suicidal ideation, 0.71 for high overall mental health risk, 0.70 for eating disorder risk, and 0.67 for insomnia. When they combined active self-reports with passive sensor data, the integrated model consistently outperformed models using either data stream alone.
| Mental Health Outcome | Balanced Accuracy | External Validation |
|---|---|---|
| Suicidal ideation | 0.77 | 0.63-0.72 |
| SDQ-high risk (overall) | 0.71 | 0.63-0.72 |
| Eating disorder risk | 0.70 | 0.63-0.72 |
| Insomnia | 0.67 | 0.63-0.72 |
SHAP analysis — a method for identifying which features drive predictions — revealed that self-reported negative thinking and location entropy were the strongest predictors across conditions. Location entropy measures how varied someone's daily movements are; lower entropy means more repetitive, restricted patterns. A teenager who goes to school and comes straight home every day, visiting no other locations, registers low location entropy — and in this study, that pattern was a red flag.
An external validation cohort of 45 additional adolescents showed balanced accuracies of 0.63-0.72, lower than the training set but still meaningfully above chance. The drop highlights a persistent challenge: these models work best when trained on data similar to the population being screened, and adolescent behavior varies enormously by culture, socioeconomic context, and individual circumstance.
What makes teenagers particularly well-suited for this approach — their deep integration with their phones — is also what makes monitoring them ethically complicated. A teenager's phone captures their social world, romantic relationships, and identity formation in a way that an adult's phone typically does not. As one ethics paper on adolescent digital phenotyping published in AI and Ethics in 2025 noted, there is a genuine risk of medicalizing normal adolescent behavior, turning the ordinary mood swings and social friction of puberty into pathological signals.
From raw data to clinical alerts: how prediction models work
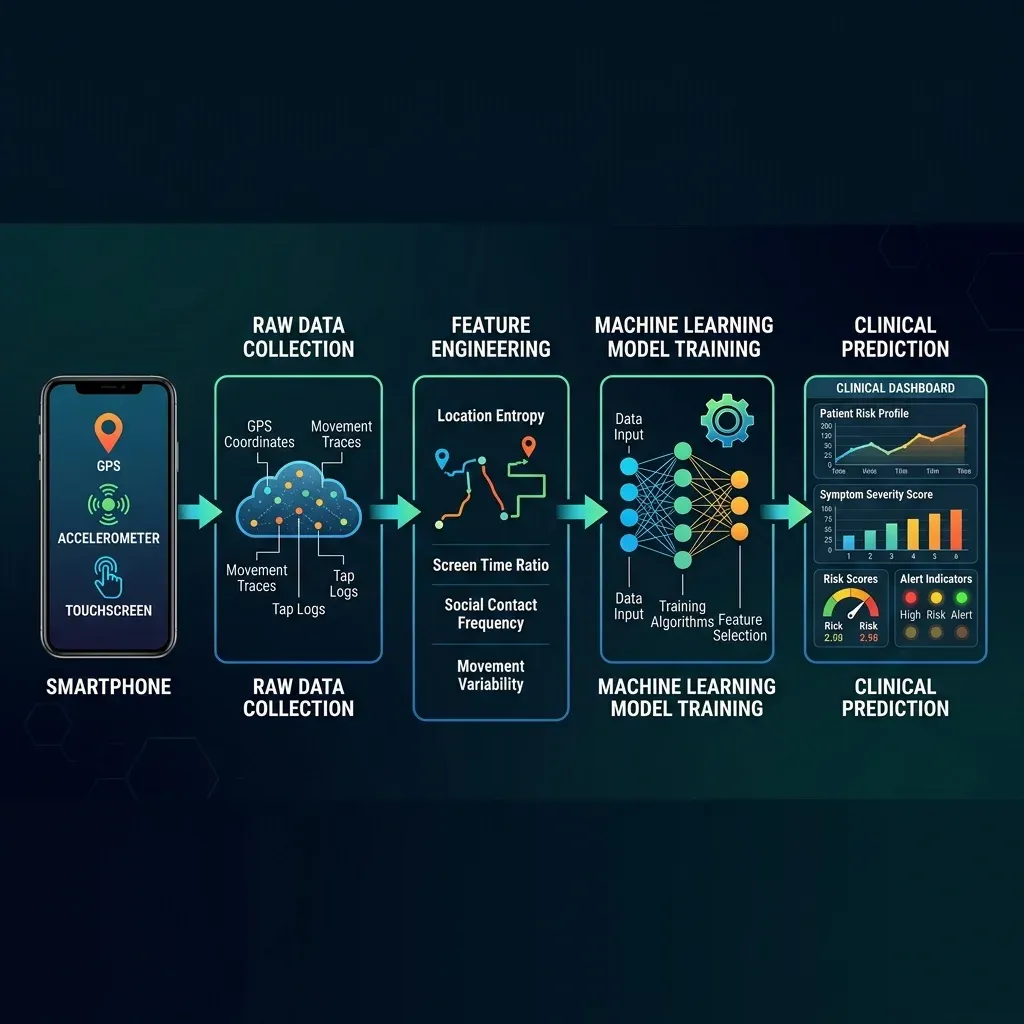
Between the accelerometer in your pocket and a clinical alert on a psychiatrist's screen, there is a pipeline of data engineering, feature extraction, and machine learning that determines whether the system is useful or noise.
The raw data is messy. A phone's GPS might update every few seconds or every few minutes depending on signal strength and battery settings. Screen-on events happen hundreds of times per day. Keystroke timing captures millisecond-level data. Before any of this reaches a prediction model, researchers must transform it into meaningful features — summarized measures like "total distance traveled today," "location entropy over the past week," or "ratio of nighttime to daytime screen use."
The Imperial College adolescent study generated 92 features from raw sensor data: GPS coordinates became distance metrics, radius of gyration, and time spent at home. App usage logs became counts by category — how much time on social media versus entertainment versus productivity apps. Step counts became binary flags: did this person walk more than 5,000 steps, 7,500, or 10,000?
Once features are extracted, models range from traditional approaches like random forests and gradient-boosted trees to deep learning architectures. A 2025 study of 183 MDD patients used a random forest with 14 digital features and achieved 76.4% accuracy predicting treatment response. A larger study of 629 participants across 56 countries reported AUC-ROC scores between 94.69% and 99.06%, with screen usage and internet connectivity features proving most influential.
Those two numbers — 76.4% and 99% — illustrate the range of what gets reported in this field, and they deserve scrutiny. The 99% figure came from a study predicting depression versus non-depression within the same population that generated the training data, a much easier task than predicting outcomes for new individuals. The 76.4% figure, which predicted treatment response in a prospective design, is closer to what clinicians would experience in practice.
The gap between laboratory accuracy and real-world performance is the central unsolved problem in digital phenotyping. Models that look excellent in controlled studies often falter when deployed in diverse populations.
An NIMH-funded study led by Daniel Adler at Cornell University demonstrated this directly. Analyzing smartphone behavioral data from 650 people, the research team found that the best-performing AI model was only moderately accurate overall — and systematically biased along demographic lines. The model skewed toward flagging older, female, Black, and low-income individuals as higher risk, while skewing toward lower risk scores for younger, male, White, and high-income participants.
The bias wasn't random; it reflected genuine differences in how demographic groups use their phones. Greater GPS mobility was associated with lower depression risk for most people — but for those with low incomes or on disability, greater mobility actually correlated with higher depression risk. The behavioral meaning of a data point depends entirely on context, and current models struggle to account for that.
There are practical engineering challenges too. GPS tracking consumes between 13% and 38% of a smartphone's battery depending on signal strength, and continuous sensing can drain a phone to empty in roughly 9 hours. For research studies where participants know they're being monitored, this is manageable. For a clinical tool meant to run invisibly in the background for months, it is a serious barrier.
When your typing speed becomes a medical record
A Stanford-led Delphi study convened experts in digital phenotyping, data science, mental health, law, and ethics and found strong consensus on one point: existing regulations are inadequate. The panel, led by Nicole Martinez-Martin, identified five priorities — privacy, transparency, consent, accountability, and fairness — and concluded that current frameworks like HIPAA were not designed for this kind of data.
The gap is specific and concerning. HIPAA protects health information collected in clinical settings. But as one panelist stated, "HIPAA criteria don't include new forms of identifiable data like keystroke kinematics." Your typing speed is not a medical record under current law. Your GPS coordinates are not protected health information when they're collected by a consumer app. Yet both can be analyzed to generate inferences about your psychiatric state that would absolutely be protected if a doctor wrote them in a chart.
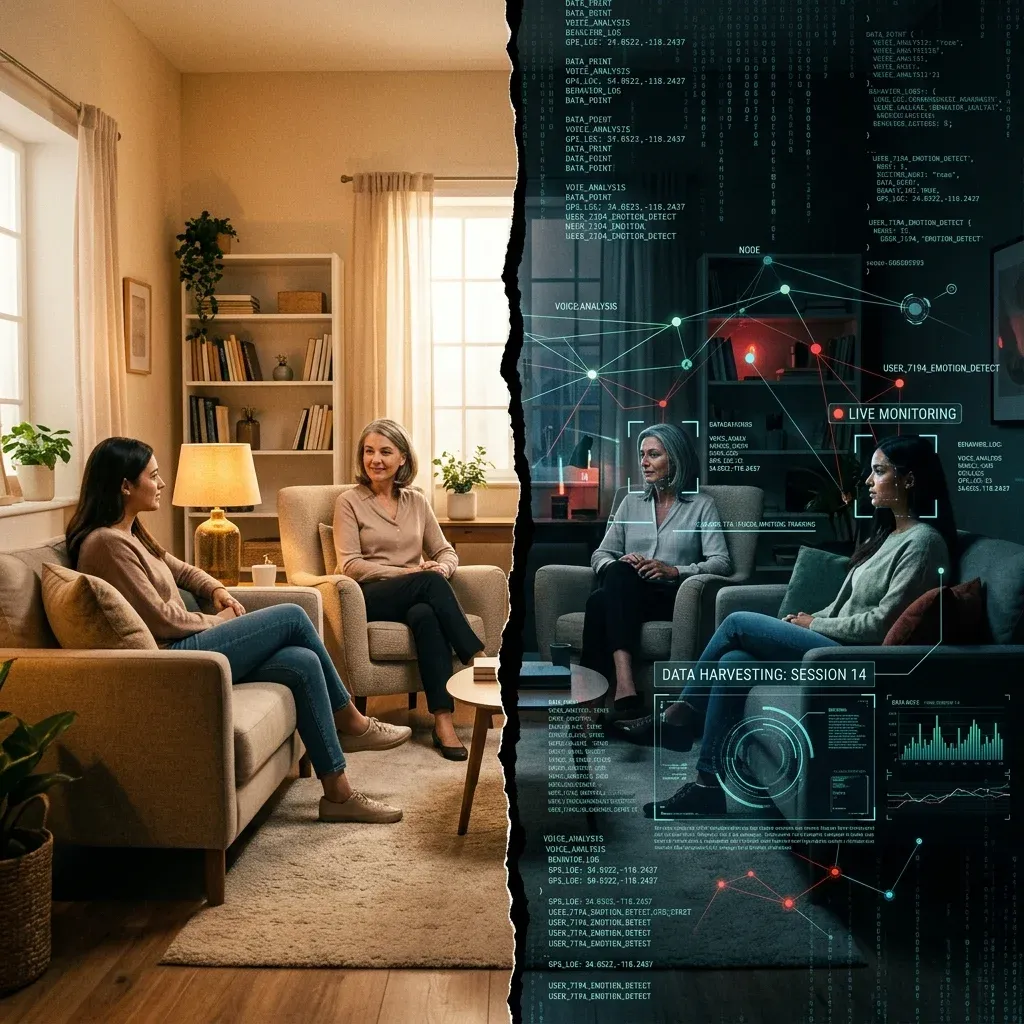
This regulatory gap becomes alarming when you look at how mental health apps actually handle data. A study cited in the Health and Human Rights Journal found that 81% of mental health apps sent data to Facebook or Google for analytics or marketing, and 92% sent data to other third parties. Users were not given a meaningful choice about whether this sharing was acceptable to them.
The Stanford Delphi panelists flagged another problem: de-identified data can be re-identified using modern data science techniques and large public databases. Raw behavioral data from a digital phenotyping app — location traces, usage patterns, typing rhythms — is inherently personal and difficult to truly anonymize. As one expert put it, "Raw data is not able to be 'non-identifying' and consent should be a norm when using or sharing personal data that has potential health implications."
| Domain | HIPAA Coverage | Privacy Risk Level |
|---|---|---|
| Clinical research (IRB-approved) | Yes | Moderate — regulated but data is extensive |
| Physician-mediated clinical use | Yes | Moderate — covered but new data types may fall outside |
| Consumer wellness apps | No | High — no health data protection requirement |
| Employer wellness programs | No | Very high — power asymmetry plus no regulation |
| Insurance risk assessment | Varies | Very high — financial incentive to use data adversely |
The potential for misuse extends well beyond advertising. Stanford researchers noted in Nature that military organizations, employers, insurance companies, and criminal justice systems all have interests in predicting behavioral states. An employer who could passively detect declining mental health in workers, or an insurer who could identify early signs of a psychiatric condition before a claim is filed — these are not hypothetical scenarios. The technology already exists. The regulatory barriers, in many cases, do not.
For adolescents, the privacy calculus is even more fraught. A 2025 paper in AI and Ethics outlined how monitoring teenagers creates a collision between parental authority, adolescent autonomy, and clinical need. Parents may have legal authority to consent to monitoring their child's phone, but a 16-year-old's location data, social interactions, and mood patterns captured during identity formation are deeply personal. The researchers argued that the structural power dynamics of technological monitoring can undermine the very sense of agency that adolescent mental health interventions are trying to build.
Consider the Abilify MyCite, the first FDA-approved digital drug in 2017, an antipsychotic embedded with an ingestible sensor to track whether patients took their medication. Critics described it as a modern-day panopticon, noting the irony of prescribing a surveillance device to people experiencing paranoia. Digital phenotyping raises a version of the same question: when does monitoring become surveillance, and who decides?
The gap between research promise and clinical reality
Tom Insel, former director of the National Institute of Mental Health, left government to co-found Mindstrong in 2017, betting that smartphone typing patterns could become a clinical tool for psychiatric assessment. He described it as a "digital smoke alarm for mental health issues" that would predict relapse "much the way we monitor progress in diabetes or hypertension." By 2020, the company had registered only one small study (N=23) on clinicaltrials.gov, with no results posted and no peer-reviewed publications.
Mindstrong's arc, from ambitious launch through limited validation to eventual difficulties, mirrors the field's broader challenge. The science is real but early. The accuracy numbers are genuine but come with caveats about population specificity, demographic bias, and the gap between controlled studies and clinical deployment.
Several facts should temper expectations. A 2023 systematic review examining 29 digital phenotyping studies found that every single one was conducted in a developed country — the United States, UK, China, Taiwan, or Germany. None were conducted in low-income settings where mental health resources are scarcest and where digital screening could theoretically have the greatest impact. Additionally, 79% of those studies were published between 2020 and 2022, meaning this is still a very young field with limited long-term validation data.
The NIMH bias study recommended developing models targeted at specific populations rather than building universal predictors. This is sensible advice but creates a scaling problem: if you need different models for different demographics, the infrastructure required for clinical deployment multiplies substantially.
The absence of standardization across the field compounds these issues. Different research groups use different apps, different sensors, different sampling rates, different feature engineering approaches, and different outcome measures. A finding from one study cannot easily be compared with or replicated by another.
| What the research shows | What it doesn't show yet |
|---|---|
| Passive smartphone data correlates with depression severity | That it works as a standalone diagnostic tool |
| Multiple behavioral markers track mood changes over time | That population-level models generalize across demographics |
| ML models can predict mental health outcomes above chance | That prediction accuracy is sufficient for clinical decision-making |
| Combined active+passive data outperforms single modalities | That patients benefit from being monitored this way |
| Relapse prediction may provide days of advance warning | That early warning translates to better clinical outcomes |
No digital phenotyping tool has received FDA clearance for psychiatric diagnosis. No professional psychiatric organization has issued guidelines recommending its clinical use. The research apps used in published studies — CrossCheck, mindLAMP, Beiwe, Mindcraft, BiAffect — remain research tools, not clinical products.
For patients, the practical takeaway is measured. If your clinician or a research study offers a smartphone-based monitoring tool, the supporting evidence is growing but not conclusive. Ask what data will be collected, who will have access, and how long it will be retained. For clinicians, the evidence suggests digital phenotyping works best as a supplement to clinical judgment, not a replacement — and that personalized models tracking individual change over time are likely more reliable than population-level risk scores.
The field is moving from proof-of-concept toward clinical utility. Whether it arrives there depends on solving three problems simultaneously: improving prediction accuracy across diverse populations, establishing regulatory frameworks for behavioral data, and earning the trust of the people whose phones would be doing the measuring.
Frequently Asked Questions
Can my phone diagnose depression without my knowledge?
Not currently. Digital phenotyping requires software specifically designed to collect and analyze behavioral data, and in research settings, informed consent is required before any monitoring begins. Standard smartphone operating systems do not perform psychiatric analysis on your usage patterns. However, consumer wellness apps may collect similar data types with varying levels of transparency about how that data is used or shared, which is why reading privacy policies for any health-related app matters more than most people realize.
How accurate are smartphone-based mental health predictions?
Accuracy varies widely depending on the study design and population. Research has reported figures ranging from 67% to 99% balanced accuracy, but these numbers come with significant caveats. Studies showing the highest accuracy often involve prediction within a homogeneous group. When models are tested on diverse populations, accuracy drops and demographic biases emerge. For clinical decision-making, the technology is not yet reliable enough to replace professional assessment.
What data does digital phenotyping collect from my phone?
Passive digital phenotyping can capture GPS location, accelerometer data (movement patterns), screen on/off times, app usage frequency and duration by category, typing speed and keystroke dynamics, call and text metadata (frequency and timing, not content), ambient light and noise levels, and step counts. In research studies, participants typically choose which sensors to enable. The distinction between "content-free" data (how you type) and "content-rich" data (where you go) is an important one for understanding privacy implications.
Is digital phenotyping regulated by HIPAA?
Only partially. When digital phenotyping is used in clinical healthcare settings by covered entities, HIPAA protections apply. But many digital phenotyping applications operate outside the clinical domain — through consumer apps, employer wellness programs, or direct-to-consumer platforms — where HIPAA does not apply. Additionally, new data types like keystroke kinematics may fall outside existing definitions of protected health information, even within covered settings.
Should I be concerned about mental health apps sharing my data?
Yes, with nuance. Research has found that the majority of mental health apps share user data with third parties including advertising and analytics platforms. Before using any mental health app, check whether it specifies what data is collected, whether data is shared with third parties, how long data is retained, and whether you can delete your data. Apps used in published research studies typically undergo institutional review board oversight, which provides an additional layer of privacy protection that commercial apps may lack.
Medical Disclaimer
This article is for informational and educational purposes only and is not medical advice, diagnosis, or treatment. Always consult a licensed physician or qualified healthcare professional regarding any medical concerns. Never ignore professional medical advice or delay seeking care because of something you read on this site. If you think you have a medical emergency, call 911 immediately.